Service Station Computer Systems
BRAND GRAPHICS / USER INTERFACE DESIGN / ICONOGRAPHY / ANIMATION / EXPERIENCE DESIGNWorking as a Graphic Designer and then as a User Experience Designer, I spearheaded the overall visual identity at SSCS across marketing and product initiatives to enhance product value, bolster client trust, and increase brand awareness.
Blog Graphics
I designed weekly blog graphics for the SSCS Blog.

Topic: Stress management

Topic: Local vendors

Topic: Dry January

Topic: Winter wellness tips

Topic: New in reusability and sustainability
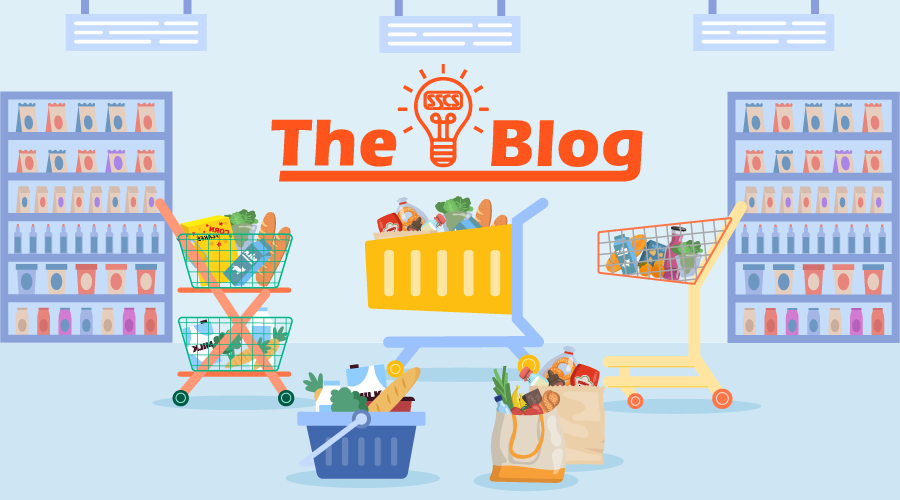
Topic: The history of the shopping cart it's impact on consumers

Topic: NACS Trade Show Recap

Topic: How c-stores can help you get your taxes done faster and easier

Topic: Gas station "hacks" for travelers on a budget, from DIY meals to cheap souvenirs

Topic: Super-charging growth with computerization: Canyon Ferry Mini-Basket (customer spotlight)

Topic: Discussing the sobriety trend and the most popular varieties of non-alcoholic options at your local c-store or gas station

Topic: Super Bowl snacks that you can buy at your local gas station or c-store

Topic: Quick car maintenance tasks you can complete while pumping gas

Topic: The future of self-service c-stores being powered by artificial intelligence
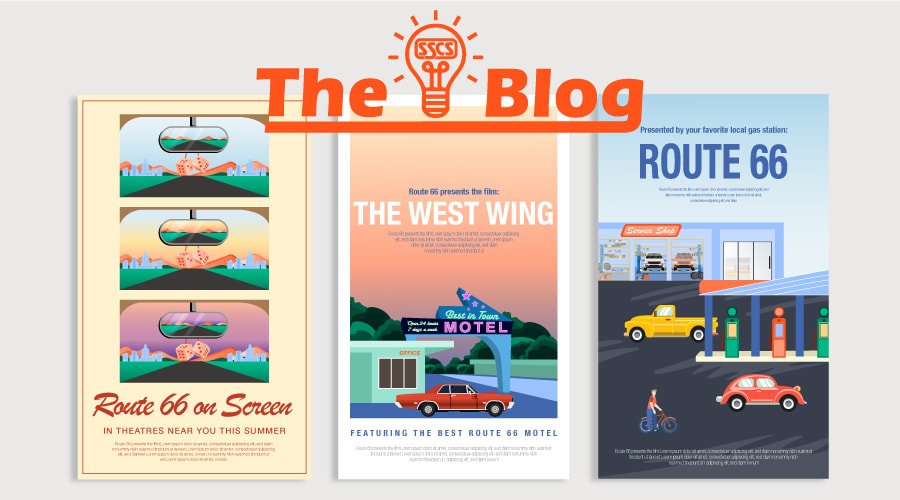
Topic: Famous gas stations and c-stores along Route 66 that have been featured in movies

Topic: The 70th anniversary of the barcode! Barcodes have been an integral part of the retail petroleum industry and have come a long way since their humble beginnings

Topic: Lottery management software updates
NACS Trade Show
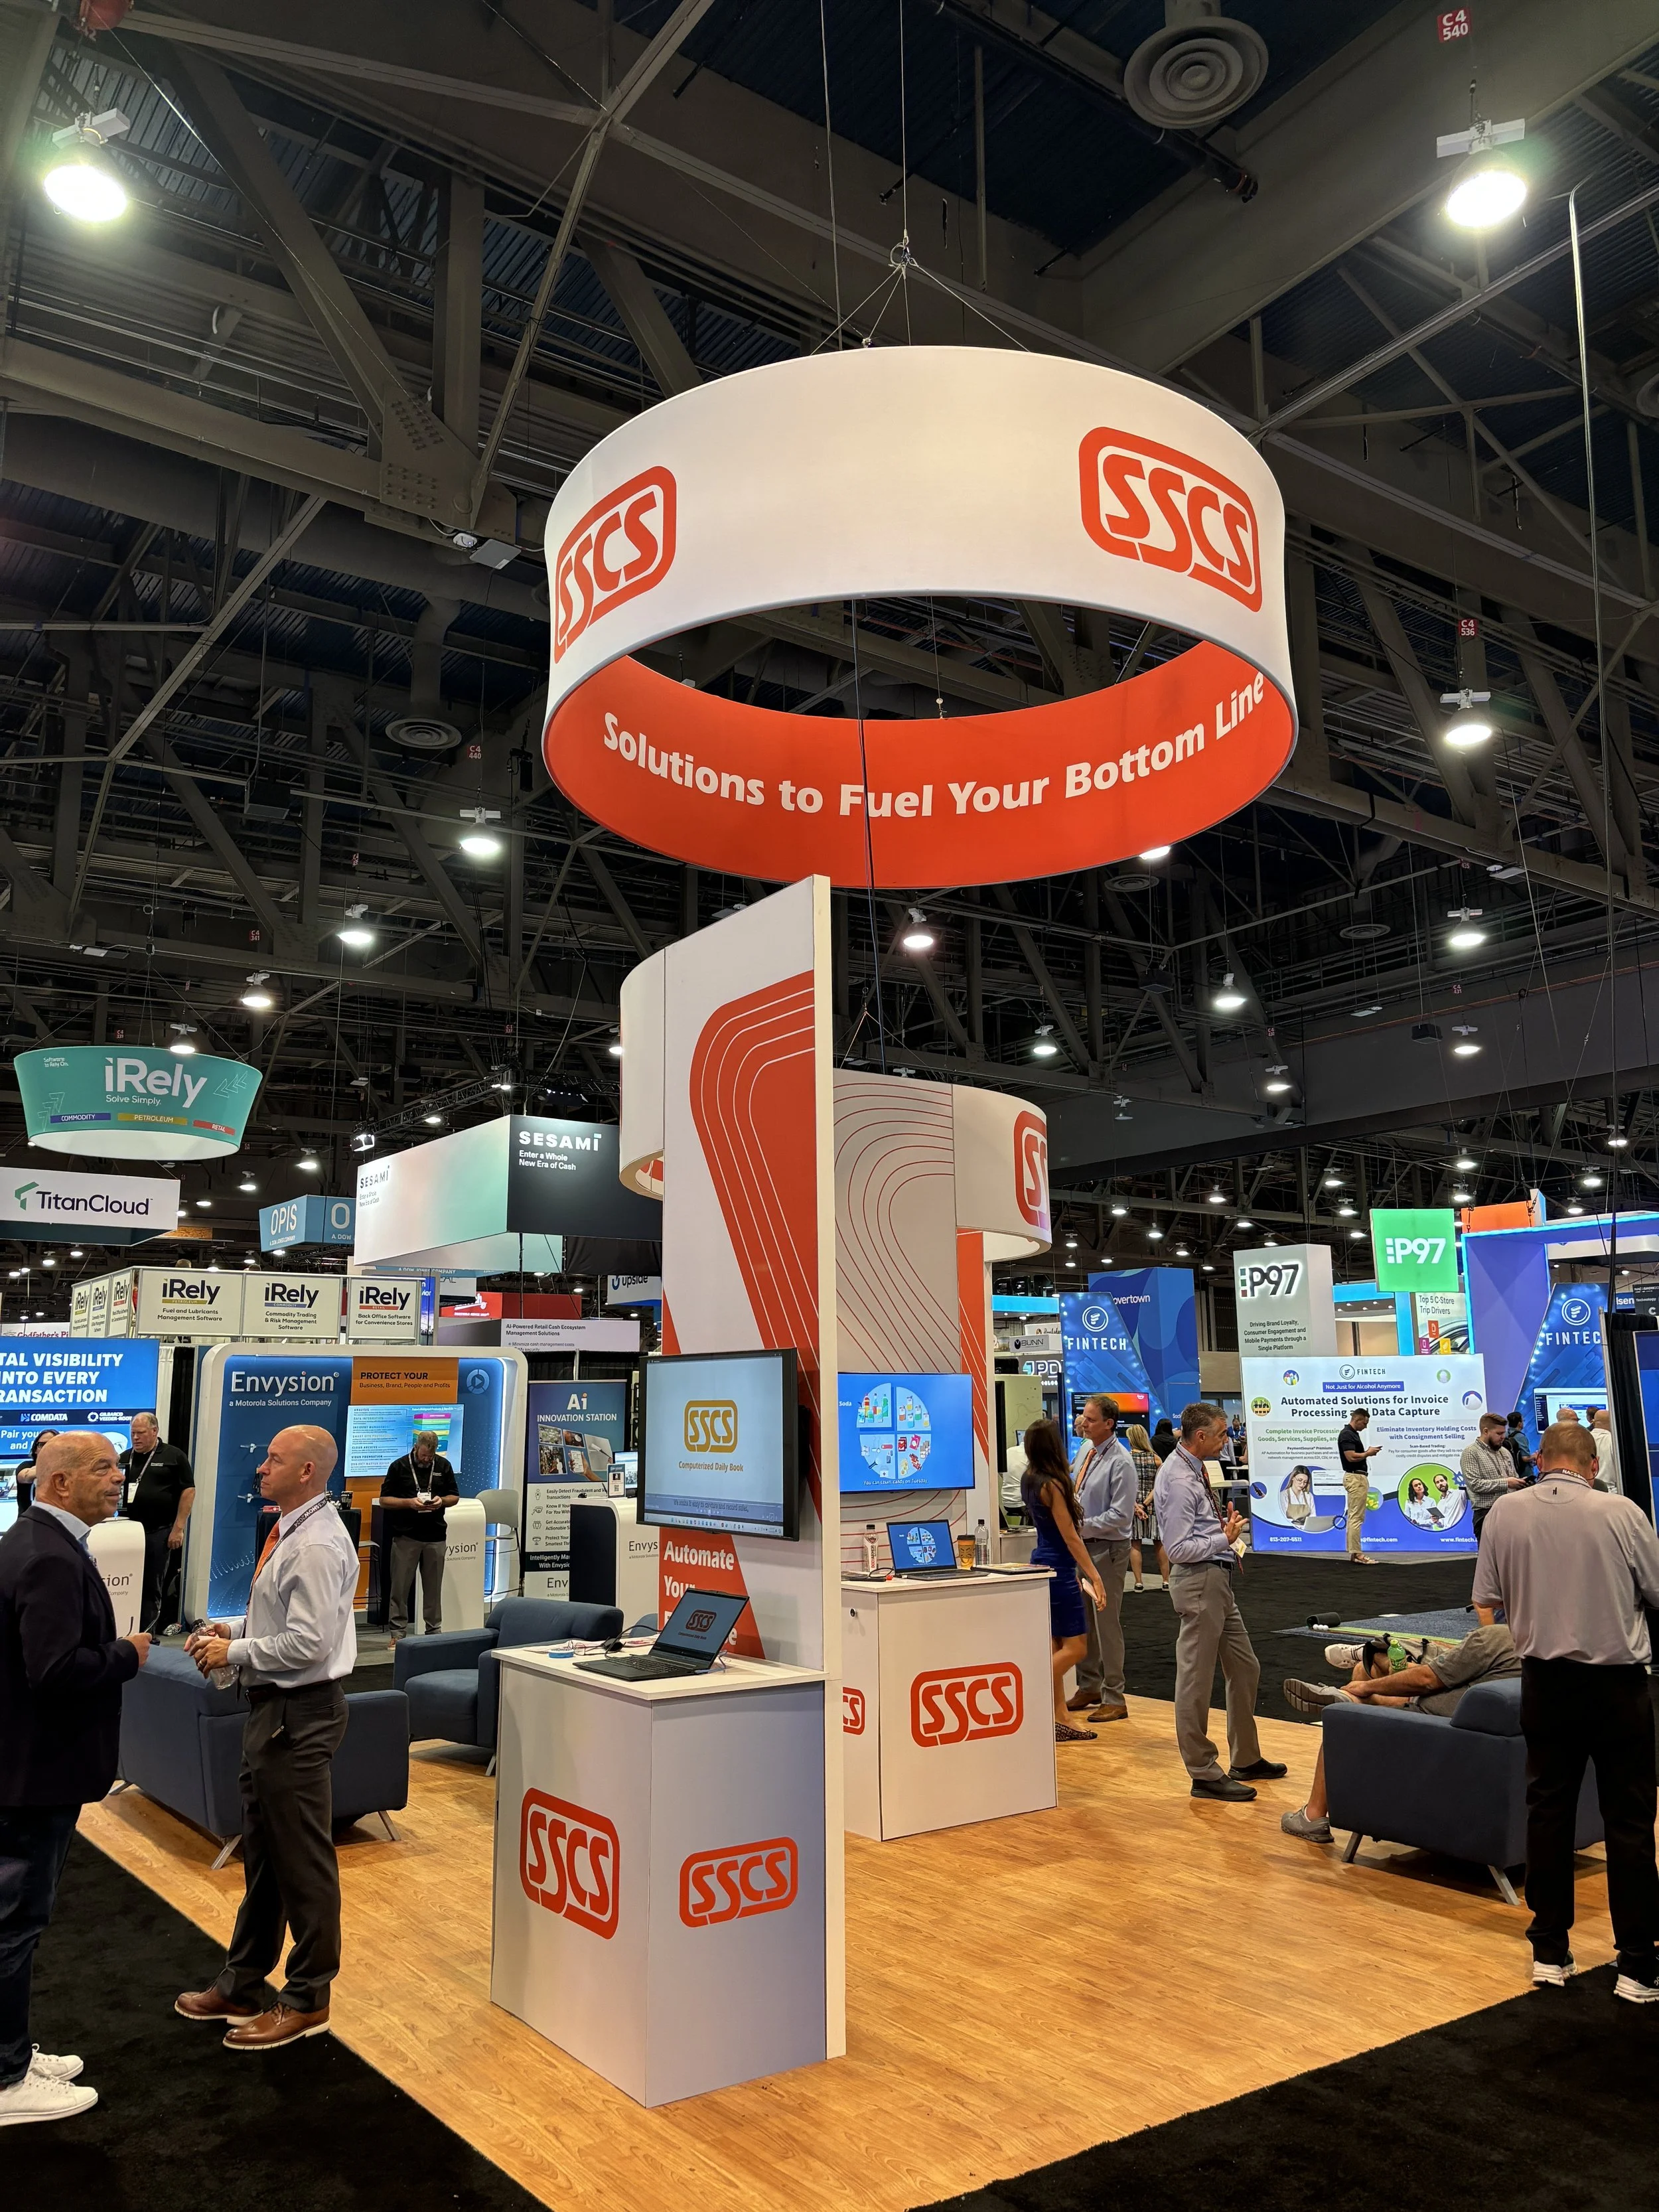
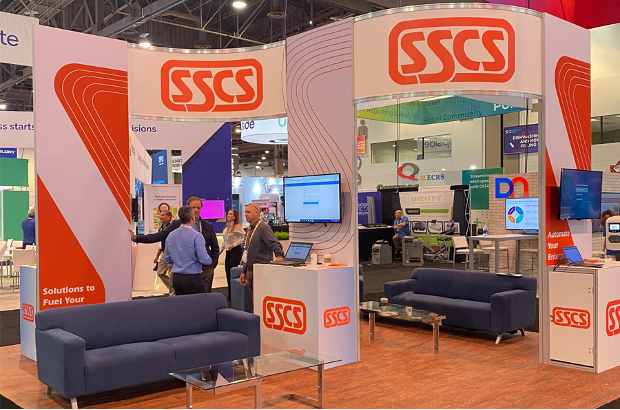
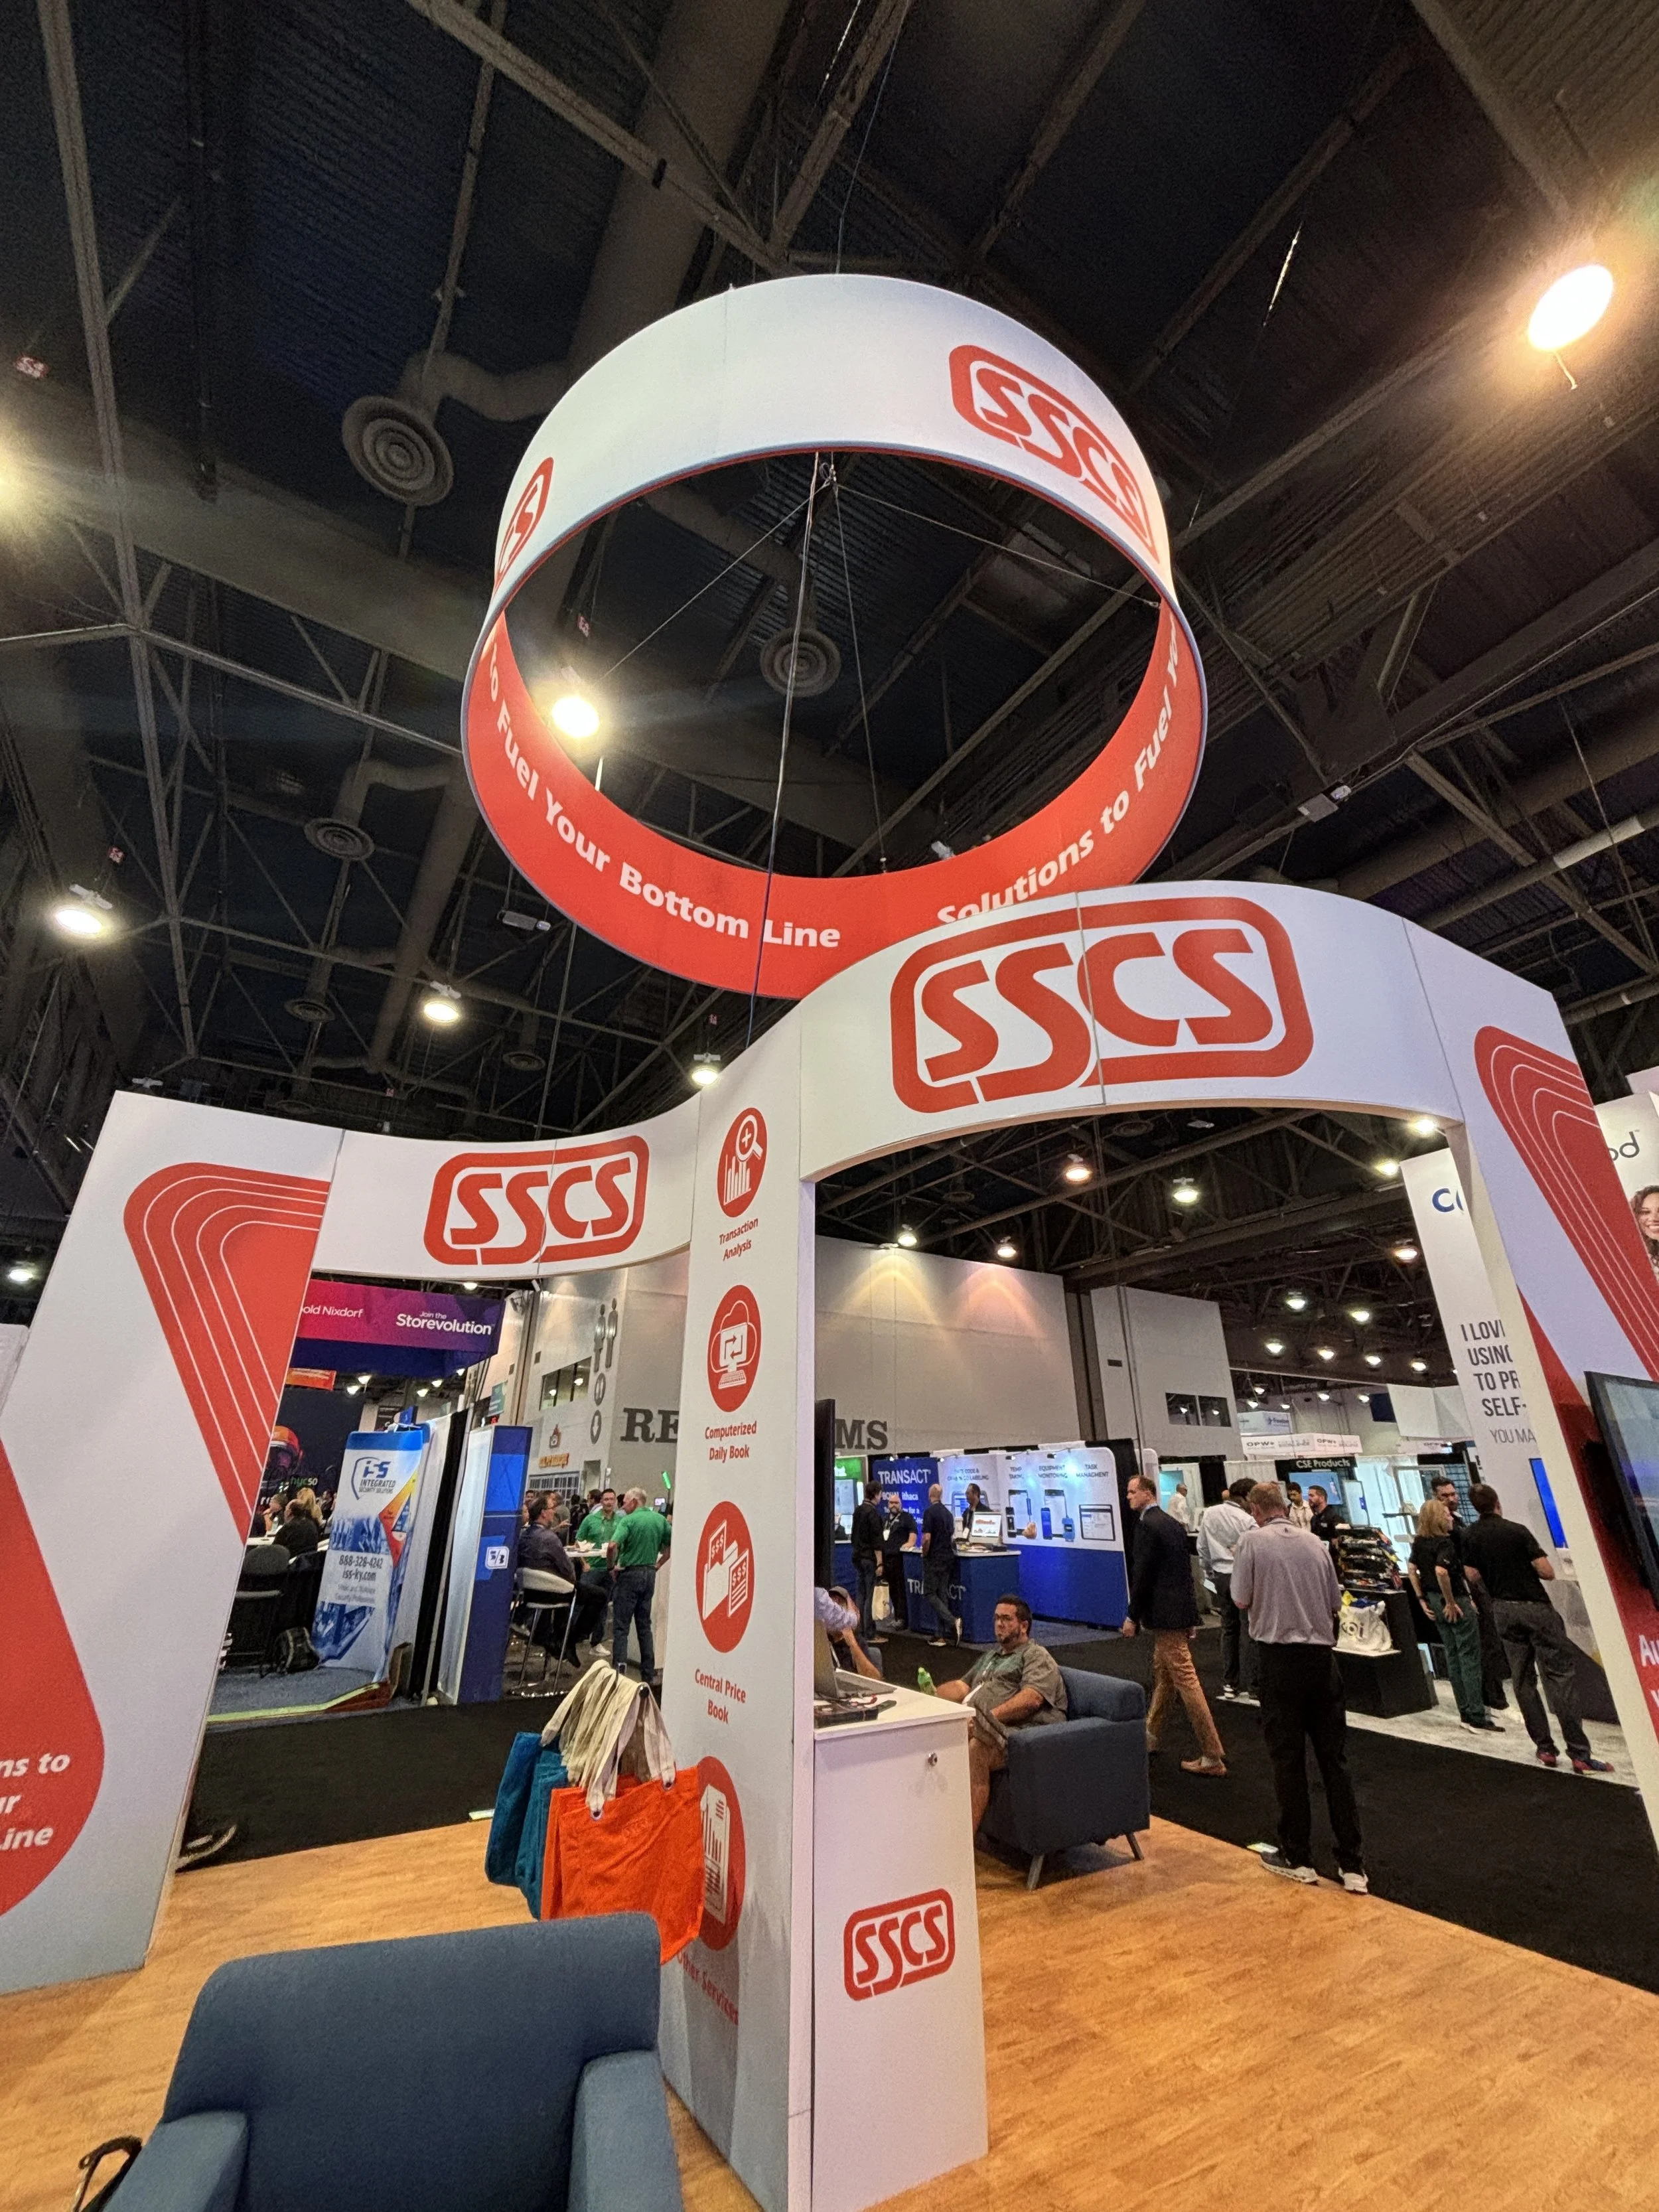
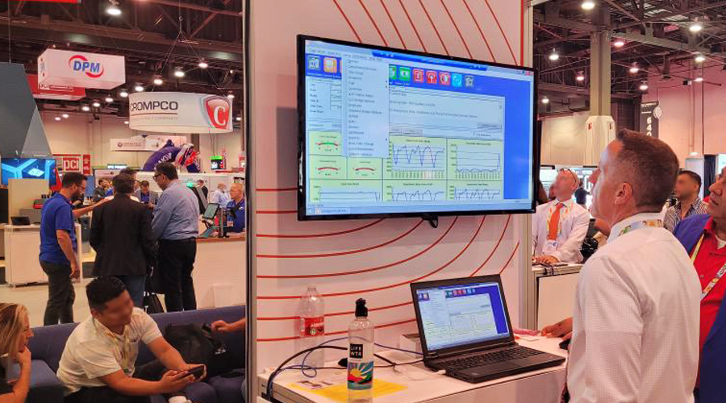
I designed a 10-foot trade show booth along with a circular hanging banner and other marketing collateral for SSCS at NACS in Las Vegas, Nevada. I collaborated with our Marketing Coordinator and VP of Sales to ensure we employed a well-rounded marketing strategy.

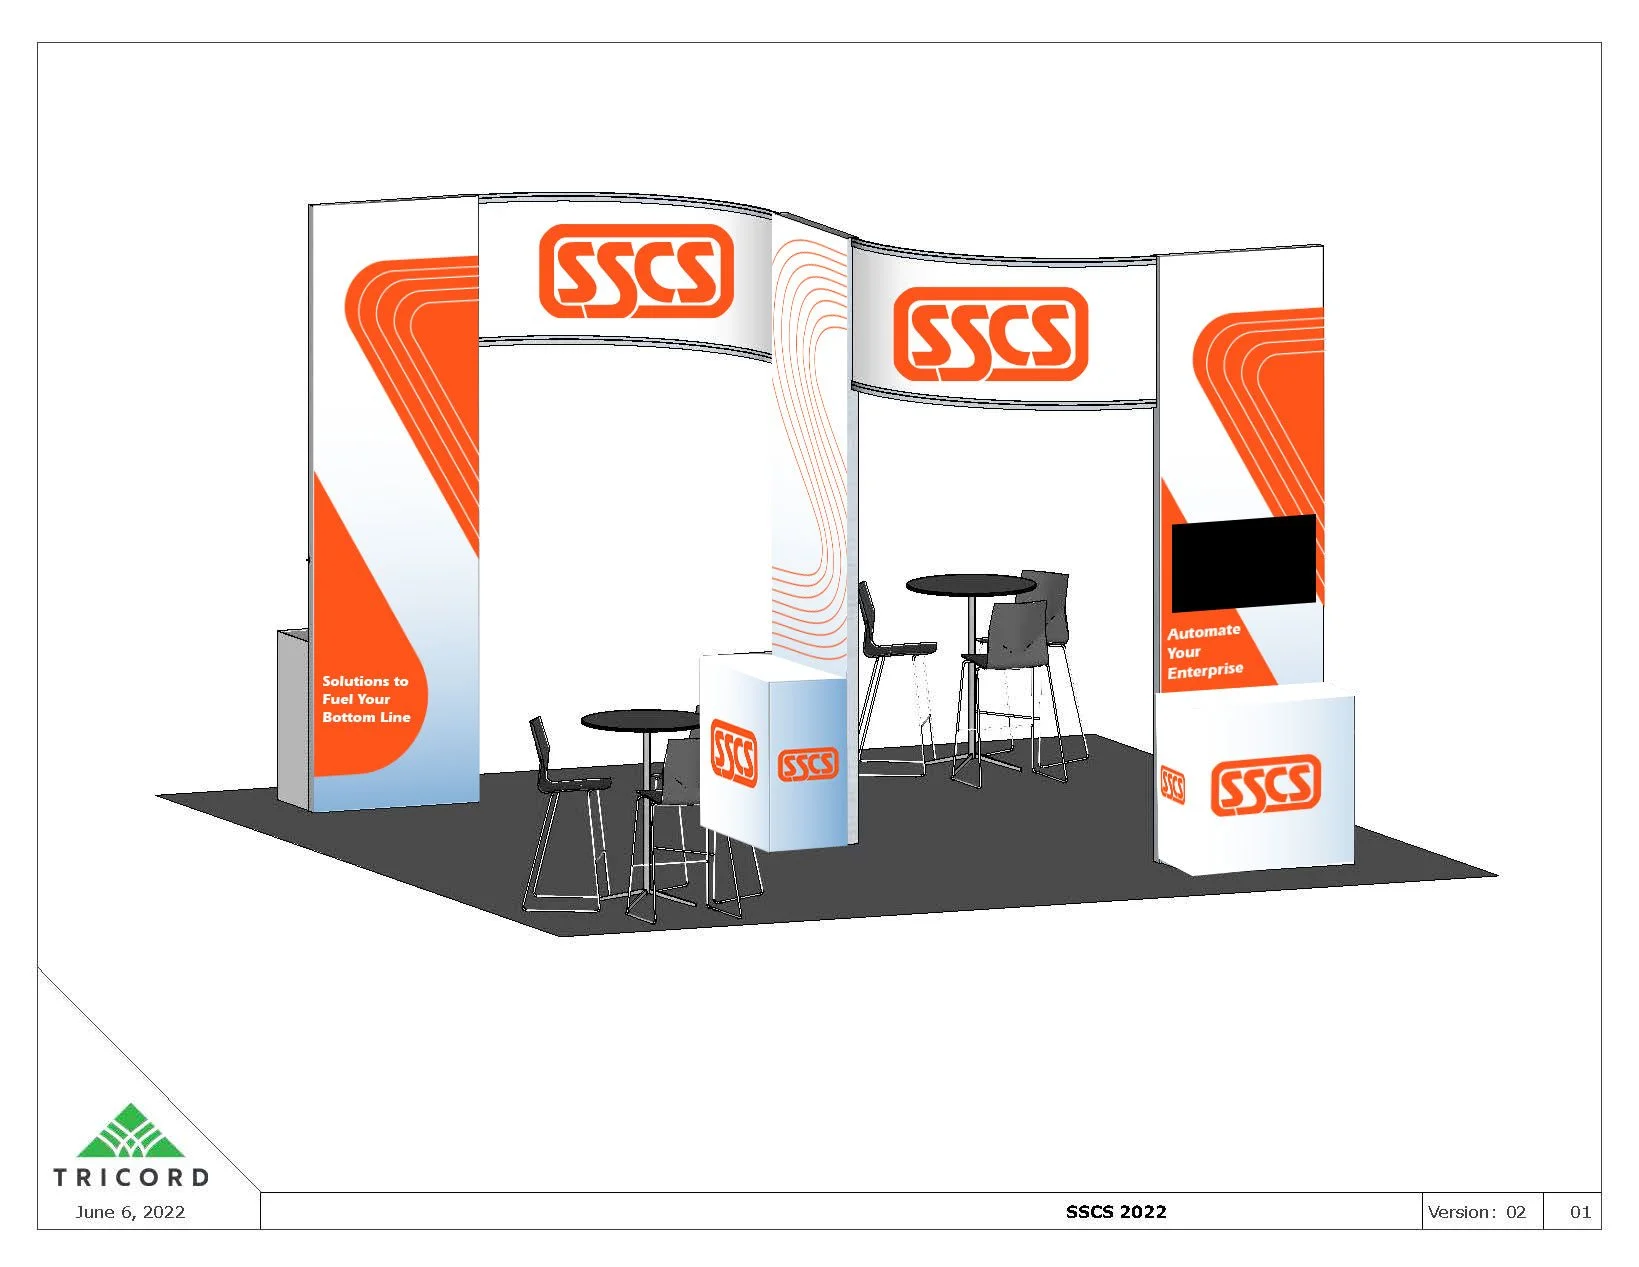
Booth Mock Ups
I took inspiration from the SSCS logo and the repetitive curvatures of the “S” letters and the surrounding rounded rectangle. I wanted to reimagine this concept on a larger scale to make the booth as instantly recognizable as the logo itself.
The Final Display
Product Cards
I designed product cards that represent the 4 main SSCS software products and feature corresponding QR codes linked to corresponding product info pages on the company website. These cards are handed out to potential customers at nationwide trade shows as well as during sales presentations.
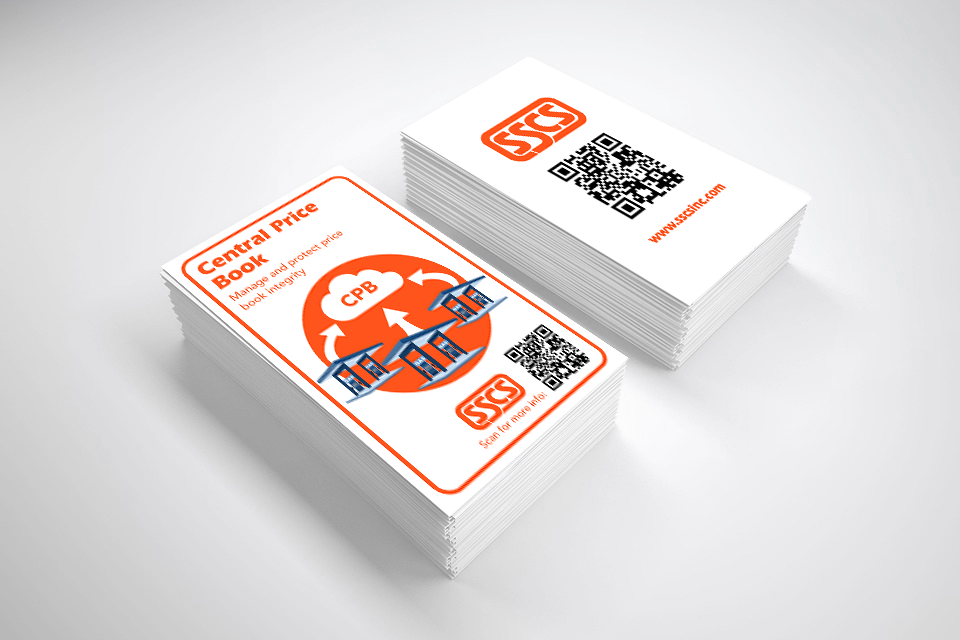
The Central Price Book provides cloud-based, enterprise price book control.

The Computerized Daily Book captures and records sales and manages inventory.

Lottery Management is designed to help you control lottery inventory.

Transaction Analysis is a web-based app that collects and analyzes data from POS systems.
Product Videos
Animations used to explains the function, purpose, and profit benefits of each software product for display at NACS.
Computerized Daily Book
The Computerized Daily Book is the industry’s most flexible, comprehensive tool for managing all aspects of a convenience store or gas station. It makes it easy to capture and record sales, manage inventory, and perform all the other daily tasks.
Transaction Analysis
Transaction Analysis is a web-based application that collects and analyzes data from POS systems. After integrating with your POS, Transaction Analysis is an indispensable tool for studying sales trends, understanding customer traffic patterns, and monitoring staff behavior at the register.
Lottery Management
A handheld app that cross checks lottery sales data with a store’s POS and helps ensure that no data slips through the cracks.
User Interface Design
I help streamline the user journey for SSCS software and web applications by applying modular design principles that create a simple and accessible workflow.

Objective
The interface needs to be familiar to veteran users who are accustomed to our previous product versions.
The interface must be equally intuitive and appealing to new users.
The designs must be on-brand and well-aligned with current trends.
Research
Research about user pain points and workflow needs are gathered via multiple internal channels:
Customer Support teams gather insights from calls
Sales team members gather feedback via relationship management
Context
SSCS creates back-office software and applications for gas stations, convenience stores, and petroleum retailers. Founded in 1981 with over 15,000 sites nationwide, customers value the product for its ability to increase profits through automation, monitoring, and standardization of crucial data.
Sample Pain Points:
Users with high-volume data have difficulty viewing the fuel dashboard on mobile devices.
Users need a way to leave notes for employees in subsequent shifts to communicate about expected deliveries, vendor issues, etc.
Alerts meant for overall staff knowledge can be dismissed by individual users, leaving subsequent users uninformed.
Users find it easy to confuse “cancel” and “delete” functions in the context of inline editing modules.
Figma Prototyping
I designed prototypes in Figma and created a shared library of assets to iterate on designs the product owner and developers.
This Figma file is for prototyping modules in the Computerized Daily Book. We use the same setup in Figma for designing prototypes for our other products as well.
I created this shared library assets in tandem with our Content Delivery Network to streamline our prototyping, iteration, and application process.
Data Visualization
Our dashboards display fuel and merchandise data in a digestible manner that visibly exposes points of interest and outliers.
Key user needs for the dashboards are that the designs need to be responsive and appealing for small and large ranges of data as well as accessible in terms of color, text sizing, etc.


Iconography
To assist users with module recognition and understanding, I design icons and glyphs that communicate function and purpose.

Manage Sites

Buydown Sales

Buydowns Owed

Deposit Reconciliation

Communication Center

Fuel Sales

Fuel Price Setup

Master Item List Mapping

Master Item List

Manage Sites